The September 19th, 2022, M7.7 Coalcoman Earthquake
An overview and preliminary analysis
Leonardo Ramírez-Guzmán, Miguel A Jaimes Téllez, Juan Manuel Mayoral Villa, Jorge Aguirre González, Gustavo Ayala Milián, Miguel Leonardo-Suárez, Moisés Contreras Ruiz Esparza, Daniel de la Rosa, Mauricio Alcaráz, Edilson Fernando Salazar Monroy, Marco A Macías Castillo, Mauricio Ayala Hernández, and the Seismic Instrumentation Unit
Collaborators
1. INTRODUCTION
On the afternoon of September 19th, 2022, an M7.7 earthquake in the Mexican state of Michoacan shook the country's central region. The Coalcoman Earthquake event occurred at 13:05:09 (local time), nearly an hour after a national earthquake drill was carried out to prepare for future catastrophic events and commemorate the 1985 and 2017 earthquakes. The earthquake caused damage and deaths, tested the emergency management mechanisms, and highlighted a crucial problem with Mexican catastrophe bonds.
The 2022 earthquake primarily affected the Mexican states of Colima and Michoacan, with minor effects in Jalisco, the State of Mexico, and Mexico City. According to the National Civil Protection Coordination – the federal agency in charge of leading all activities at the federal level to mitigate the effects of natural hazards – structural and nonstructural damage occurred in 5,972 houses and 116 schools. Regarding health infrastructure, 1 hospital reported severe damage, and 32 reported minor damage. Further, 21 churches reported minor damage (19 in Michoacan and 2 in Colima). Damage to roads included two bridges and four rockslides. Three fatalities were reported (CNPC, 2022a).
The unfortunate coincidence of the repetition of three large-magnitude events on the same day in different years raised several questions among the population regarding the likelihood of earthquakes occurring on the same date. Some people now believe large earthquakes in Mexico can frequently occur on September 19th, while the odds make such a realization rare.
In this document, we present a summary of the information available, including ground motion recordings and reports on the damage in the country. This document provides a source of information reflecting the early efforts of researchers at the Institute of Engineering and collaborating institutions in Mexico.
2. SEISMICITY AND SEISMIC VULNERABILITY OF THE REGION
Mexico is prone to experience frequent large-magnitude earthquakes. According to the National Seismological Service (SSN), 128 seismic events with a magnitude 6 or larger occurred in the country within the last twenty-two years (see Figure 1). Most of those earthquakes occurred on the Pacific coast of Jalisco, Colima, Michoacan, Guerrero, Oaxaca, and Chiapas states. They all obeyed the regional tectonic features occurring in the boundary of the tectonic plates. The September 1985 and 2022 events were part of the subduction process of the Cocos plate under the American plate, which converges with velocities varying from 4.8 to 7.5 cm/year from west to east (DeMets et al., 1994).
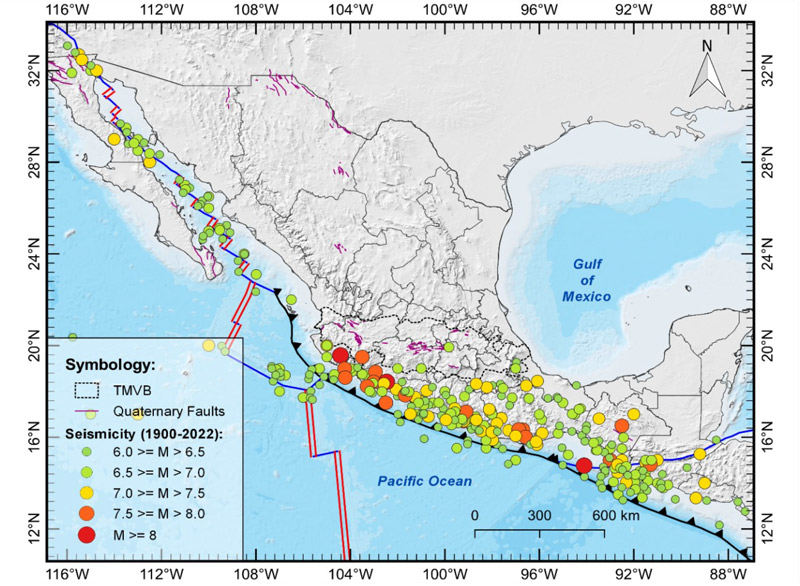
Figure 1. Earthquakes of magnitude greater than 6 using data between 1900 and 2022 in Mexico
On September 19th, 1985, the M8.1 Michoacan quake caused significant damage and deaths in Mexico City despite occurring more than 300 km away. A large M7.6 aftershock followed the mainshock after approximately 32 hrs. Another earthquake, the M7.1 Puebla-Morelos event, occurred on September 19th, 2017, 32 years later. The epicenter was located 120 km away from Mexico City. Although the magnitude was smaller than that of 1985, the 2017 earthquake caused significant damage to structures and resulted in several deaths not only in Mexico's capital but also around the central region of the country. This year, precisely 37 years after the 1985 and 5 years after the 2017 earthquakes, an M7.7 earthquake occurred again on September 19th. This event was a subduction earthquake with an inverse focal mechanism and epicenter located in front of the coast of Michoacan state with a depth of 15 km (SSN, 2022). A large aftershock of M6.9 took place approximately 60 hours after the 2022 event.
The high seismic vulnerability of existing structures in Mexico, and particularly in Mexico City, was evident during the 1985 Michoacan earthquake. The intensity surpassed what was then contemplated in building codes for Mexico City. Consequently, 7,400 buildings were affected, of which 265 collapsed and 775 were severely damaged during the event (Meli, 1986). The number of deaths was estimated to be between 10,000 and 15,000 (EM-DAT 2022). Economic losses exceeded US$ 4.1 billion (i.e., ~US$ 10 billion in 2022 dollars as corrected by inflation) (EM-DAT 2022). According to Rosenblueth and Meli (1986), the observed intensities left little doubt about the dominant cause of structural damage; the building code provisions (1957 and 1979) were insufficiently conservative to cover the intensity of the 1985 earthquake over a wide range of natural periods of vibration. Several buildings were demolished after the earthquake, but others were considered reparable and were retrofitted. However, the retrofitted buildings were likely damaged after other large earthquakes struck Mexico City. Prior studies (e.g., Meli, 1986), observed that previously damaged structures that were retrofitted after large Mexican earthquakes (e.g., 1957 and 1979) performed almost as poorly as the non-retrofitted buildings (i.e., non-retrofitted after 1957 and 1979) during the 1985 earthquake (Rosenblueth and Meli, 1986).
The M7.1 2017 Puebla-Morelos event also illustrated the high seismic vulnerability of the existing structures in Mexico City, causing significant damage (US$ 6.2 billion in losses, EM-DAT 2022). This intraslab event, the second most destructive earthquake in Mexico City in recent times, occurred on the same date as the most destructive quake in the recent history of Mexico City. It is important to note that the intensity of the 2017 earthquake did not surpass the intensities contemplated in the 1987 or 2004 Mexico City building codes. Nevertheless, 38 multistory buildings collapsed, thousands more were damaged (e.g., 3,393 dwellings damaged in Mexico City, 40% estimated with total damage, CDMX 2018), and 369 human lives were lost.
On the afternoon of September 19th, 2022, just over an hour after a nationwide earthquake-awareness drill, the M7.7 Coalcoman earthquake shook the country's central region, causing three deaths and primarily affecting the states of Colima and Michoacan. Minor effects in Jalisco, the State of Mexico, and Mexico City were also reported. This earthquake shocked the Mexican people not only because of its damaging and psychosocial risk factors (e.g., stress, anxiety, or distress) but also because it occurred precisely on the same date as the 1985 and 2017 catastrophic earthquakes that remain in the memory of many Mexicans. Some people now believe earthquakes in Mexico are more likely to occur on September 19th. Almost immediately on social networks, some researchers published the chances of three earthquakes with a magnitude greater than 7 occurring on the same day in Mexico. One researcher tweeted that the probability was 0.000751% (Mateos, 2022). Another researcher using simulations tweeted that the probability of observing 2 and 3 significant seismic events occurring the same day is 0.76 and 0.016, respectively, over a period of 120 years at a rate of 0.4 earthquakes/year (Ordaz, 2022); these latest odds are outstanding. However, the choice of September 19th as the date for a national earthquake drill and Memorial Day for the victims of the 1985 and 2017 earthquakes is essential because many people have strong memories of these seismic events, which may help to promote the need for earthquake drills, from psychological and mass-media standpoints (Jaimes and Garcia-Soto 2019).
3. SOURCE, GROUND MOTION, AND TSUNAMI CHARACTERISTICS
According to the National Seismological Service (SSN), the Coalcoman interplate earthquake had a fault reverse mechanism with strike=101.9°, dip=81.7°, and rake=86.3°. It occurred near the coast of Michoacan with a hypocenter at latitude 18.24°W, longitude 103.29°N, and depth of 15 km (SSN, 2022). The slip model obtained by the Center of Geosciences at UNAM (Mendoza and Martinez-Lopez, 2022; Mendoza, personal communication, September 20th, 2022) shows two large slip areas with a peak of 1.29 m. Figures 2 and 3 show the source parameters obtained from the earthquake report published by SSN, the finite fault, and some recorded ground motions.
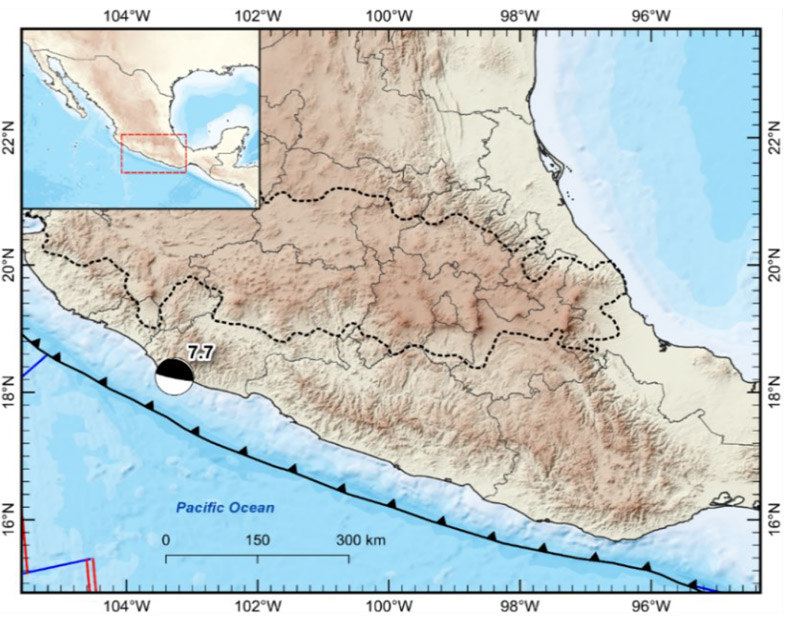
Figure 2. Epicenter and focal mechanism reported by National Seismological Service.
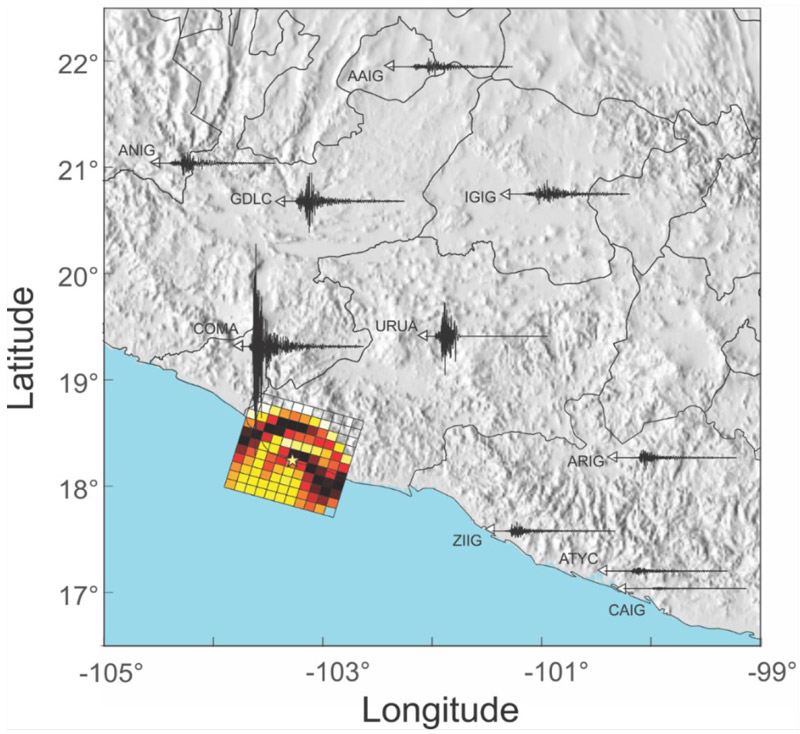
Figure 3. Finite fault model (Mendoza and Martinez-Lopez, 2022; Mendoza, personal communication, September 20th, 2022), epicenter (yellow star), and recorded ground velocities integrated from the north component of the acceleration records from UNAM's networks. All signals are displayed with the same scale.
3.1 Ground Motions
Figure 4 illustrates the finite fault model, including the velocity records at several stations around the epicenter. The source has two distinct regions of high slip northwest and southeast to the epicenter (depicted with a yellow star), from we can anticipate directivity effects. In addition, the amplitude and duration of the station displayed. Stations ARIG, ZIIG, ATYC, and CAIG have low amplitudes and long durations, while COMA, GDLC, and ANIG have pulses that are likely related to directivity (Somerville et al., 1997). To aid the discussion, we performed a simulation using Mendoza's source model, the finite element toolchain Hercules (Tu et al., 2006; Bielak et al., 2010), and a crustal velocity model based on a full-wave tomography (Juarez-Zuñiga and Ramirez-Guzman, 2016). The simulation, valid up to 0.5 Hz, clearly shows that the energy propagates preferentially towards the north and northwest, but some high amplitude wavefronts impinge towards the northeast (station URUA in Figure 4). We highlight the probable directivity and the focusing; both might explain the pattern distribution of the reported damages.
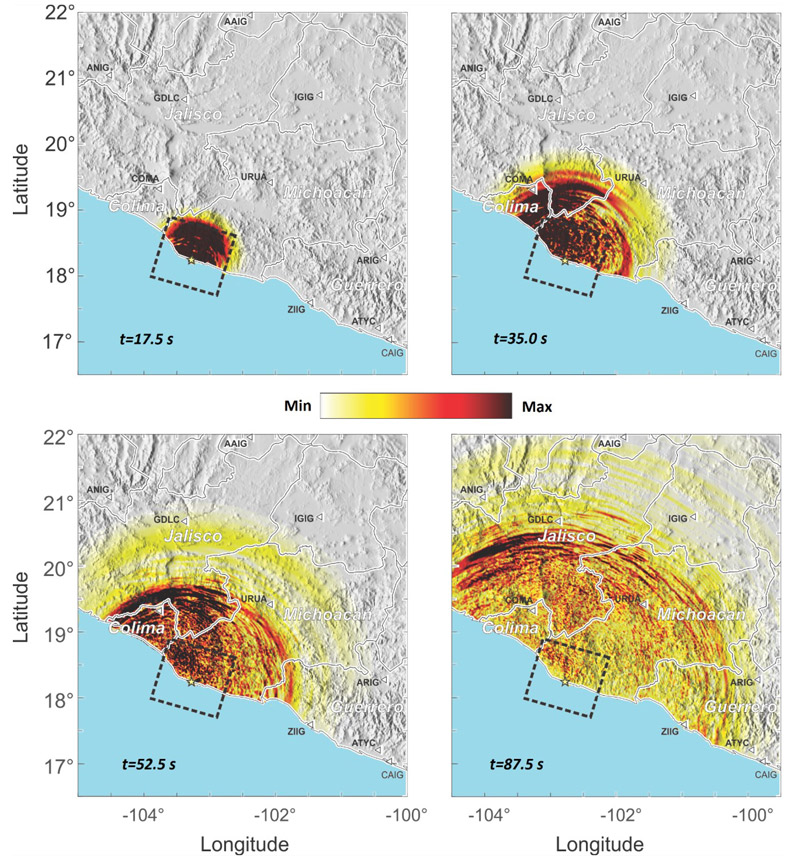
Figure 4. Ground motion simulation. The colormap depicts the modulus of the horizontal velocity at times 17.5, 35, 52.5, and 87.5 s.
Soon after the event, the Seismic Instrumentation Unit at the Institute of Engineering released ground motion parameter maps estimated using a Bayesian kriging algorithm and the records from UNAM's network. Figure 5 presents the spatial distribution of the root mean square (RMS) of the horizontal (north-south and east-west components) peak ground accelerations and spectral response (SA) for structural periods (T) of 1 and 2 s. Only the recordings obtained on hard-rock sites are included in the computations. These maps provide a quick representation of the extent of potentially damaging shaking generated by the 2022 earthquake (i.e., light, moderate, and severe). The Coalcoman earthquake generated moderate to high intensities around the epicentral region. The highest RMS PGA, and SA at T 1 and 2 s, recorded at station MMIG, were 902 cm/s2, 219 cm/s2, and 84 cm/s2, respectively.
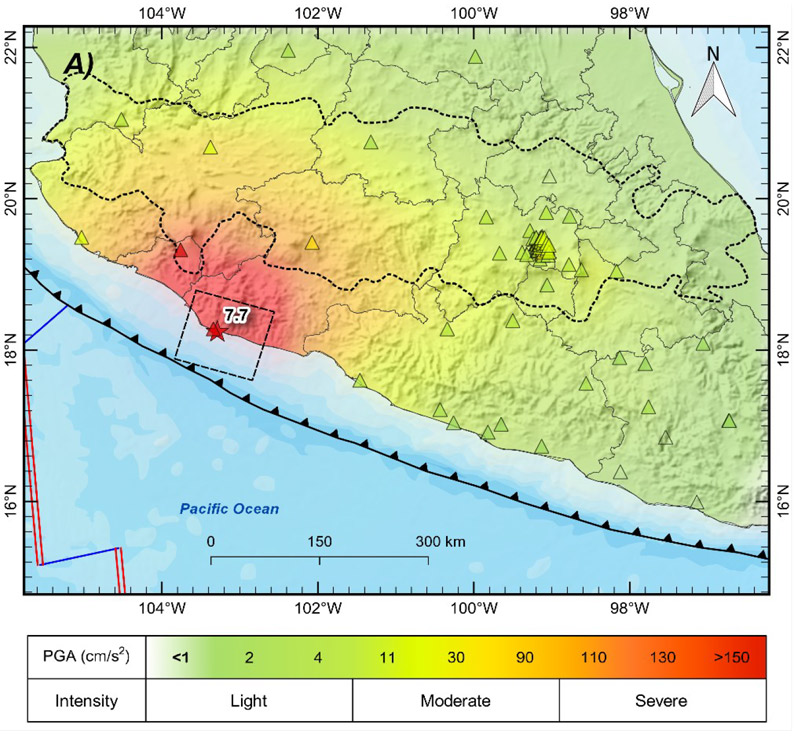
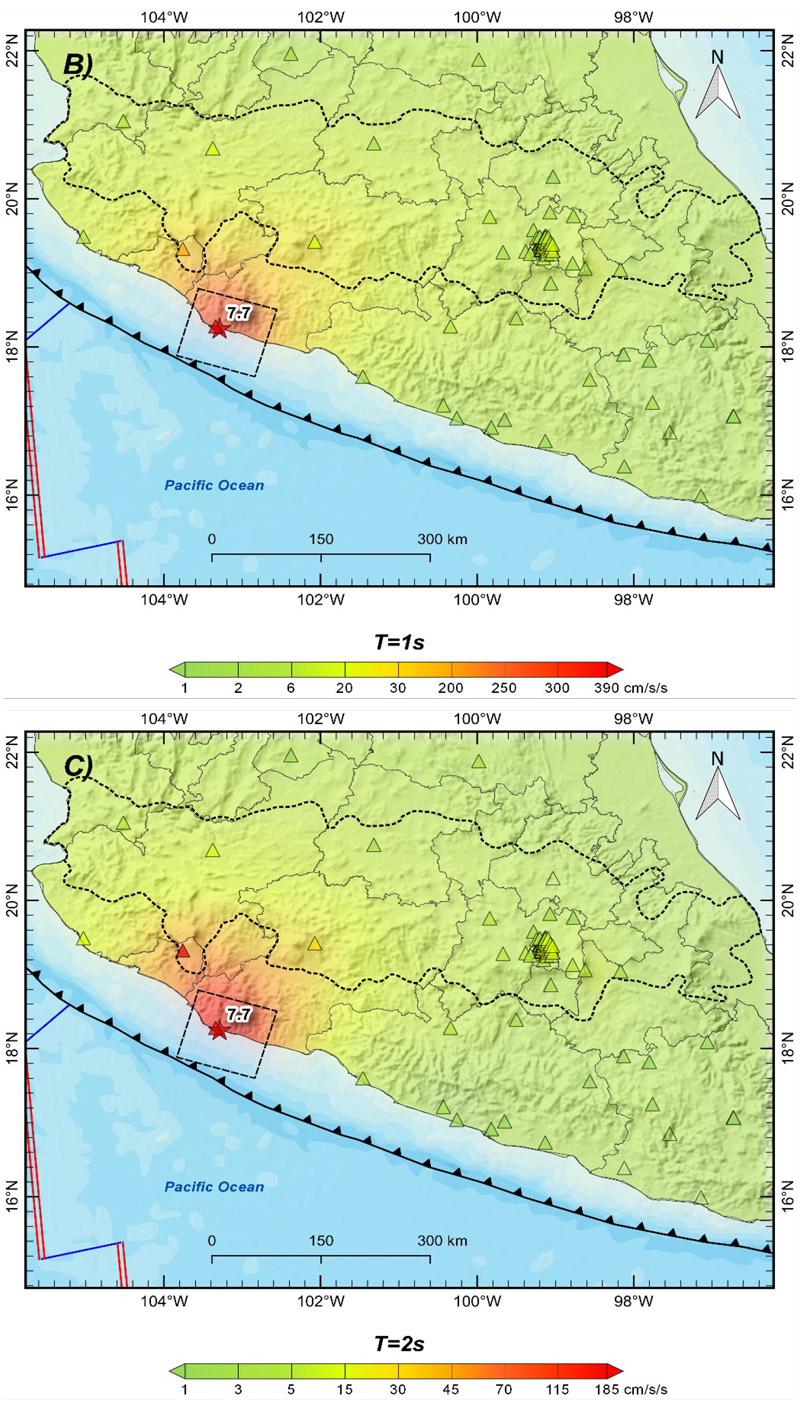
Figure 5 Ground motion parameters maps. A) Peak ground acceleration. B) and C) spectral acceleration for T=1 and 2, respectively.
Significant areas of Mexico are vulnerable to earthquake-triggered tsunamis. Over 60 tsunamis originated within this region from 1732 to 2022. The tsunamigenic events have had magnitudes greater than 6.9, so it was reasonable to assume that an M7.7 event could generate a significant tsunami. According to the National Mareographic Service (SMN 2022), the peak wave height in stations near the epicenter was 1.75 m in Manzanillo and 0.635 m in Acapulco. To better understand the wave height on the coast, we performed a simulation using the GeoClaw tsunami model (e.g., LeVeque et al., 2011) and the USGS source (USGS, 2022). The tsunami amplitude profile was computed for reference points near the coastline at an isobath of 1.5 m, see Figure 6. High-resolution bathymetry was only available in ports near the epicentral region. Even though the wave height modeled underestimates the reported values without considering any correction, qualitatively, the distribution depicted in Figure 6 is consistent with the information from the Tsunami Warning Center of the Secretary of the Navy, which issued an alert expecting abnormal sea level variations up to 0.82 m above the tide level (CNPC, 2022b).
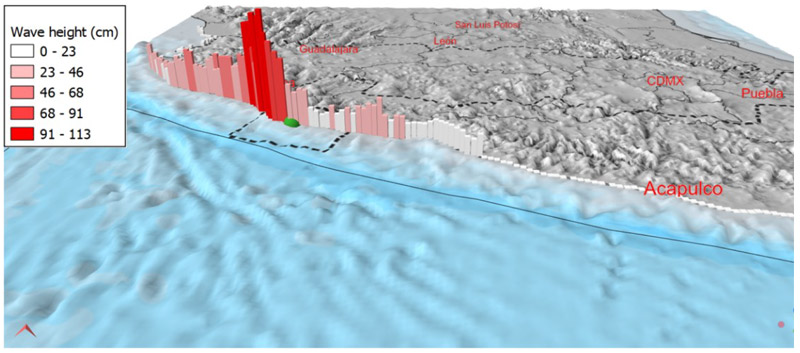
Figure 6 Maximum tsunami wave height along the Mexican shoreline. Green sphere denotes epicenter and black dashed lines, fault-plane area.
3.3 Observations vs ground motion prediction models
In Figure 7, observations and the ground motion prediction equations (GMPE) of Zhao et al. (2006), Arroyo et al. (2010), and NGA-Subduction Global 2022 (Parker et al. 2022) for RMS PGA and SA for T=1 and 2 s for subduction earthquakes are compared. As shown, the GMPEs are in reasonably good agreement with the observed values. Figure 7 also includes the predicted model's 16th and 84th percentiles (shaded region). The observed intensities are roughly between the uncertainty bounds displayed. For short distances, the model by Arroyo et al. (2010) provides a good estimation, and the NGA-Subduction Global (2022) performs better for larger values of Rrup. The former is expected since the equation's range of validity is 400 km, while the latter covers a broader range. We include the intensity values in Mexico City, where the known site effect is evident.
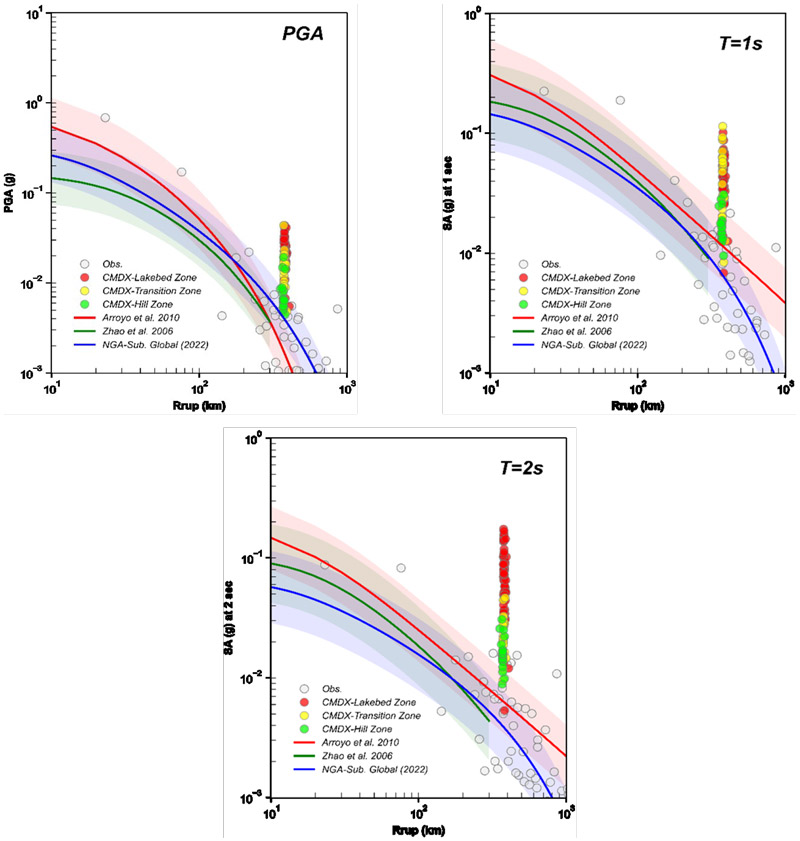
Figure 7. GMPEs vs observations. Curves of the RMS of horizontal component of PGA (top left), SA at T=1 s (top right) and SA at T=2 s (bottom) for Mexican subduction earthquake with M7.7. Observations (Obs) in rock sites are displayed in white circles. Green, yellow and red circles display RMS values within Mexico City in the Hill, Transition and Lake zones.
The seismic intensities recorded at Mexico City's reference site station, CU (Ciudad Universitaria), are a good indicator of intensities and damage across the city, i.e., severe damage in the city is expected when high seismic intensities occur at CU station. Examples include the 1985 M8.1 subduction and 2017 M7.1 intraslab earthquakes. For the former, large seismic intensities for the CU station record are well correlated to the soil period range of 1.8-2.5 s, and for the latter, the soil period range of 0.5-1.6 s coincides with the most damaged zones in the city during these events (in terms of the predominant period of the site); similar patterns are expected for future destructive interplate and intraslab earthquakes (Singh et al., 2015). Figure 8 compares the response spectra estimated with the GMPEs by Reyes (1999) and Jaimes et al. (2006) for the CU site against the spectrum of the Coalcoman earthquake recorded at this station. Figure 8 also includes ± one standard deviation for each predicted model (shaded region). Both prediction models overestimate the ordinates, which might be due to a need to review the source parameters or a required update of the GMPEs.
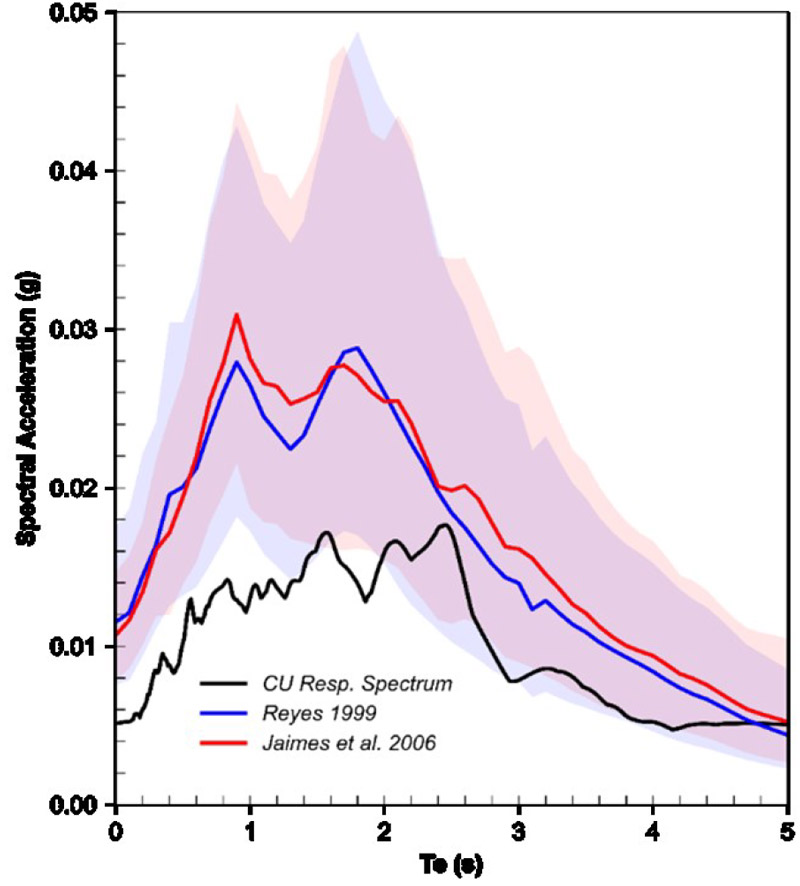
Figure 8. Response spectra at station CU: exact spectra and spectra obtained with GMPMs for Mexican subduction earthquake with M7.7.
4. DAMAGE, EMERGENCY RESPONSE SYSTEMS, PERFORMANCE AND PREPAREDNESS
4.1 Damage
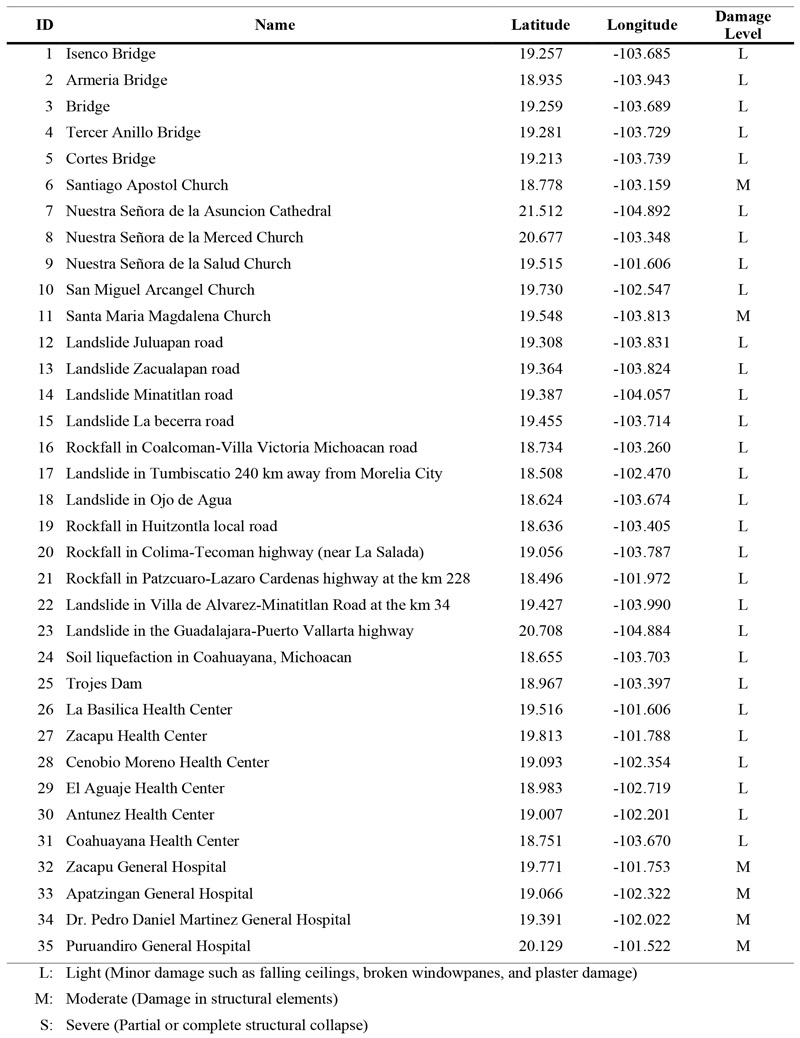
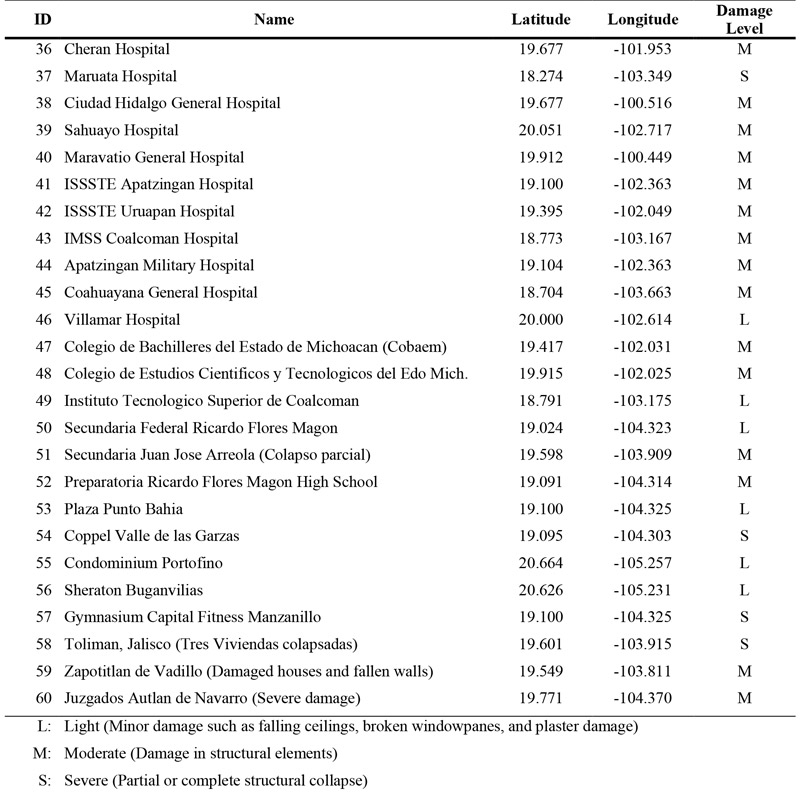
Figure 9 shows the spatial distribution of the peak ground acceleration (PGA) and the damage reported by the media throughout the region affected by the September 19th, 2022, Earthquake (UIS-II-UNAM 2022). The acceleration can be associated with light, moderate, and severe damage, even collapse, at affected sites near the epicenter (see Table 1). Structural damage primarily affected housing – about 6,000 houses were reported damaged— from which the most significant reports are in adobe and unreinforced brick masonry houses (CNPC, 2022a). Notice that damage was concentrated along a strip extending from the coastal region, near the epicenter, toward the northeast.
According to the geotechnical observations, a series of small rock falls occurred along road cuts. Michoacan's slides were common along the cut slopes adjacent to roads near the epicenter. Ten failures related to slope instability were reported. These failures included rockslides and landslides that impacted the local transportation network near the epicenter; both entailed earth, rock, and surficial raveling. Also, damage associated with bearing capacity failure occurred, causing the lateral displacement of a wall in a high school located in Manzanillo. Soil liquefaction occurred in Coahuayana, Michoacan, about 50 km northeast of the epicenter. This phenomenon affected Coahuayana's beach. In general, there were no observations of significant soil liquefaction damaging structures at the moment of this report's publication.
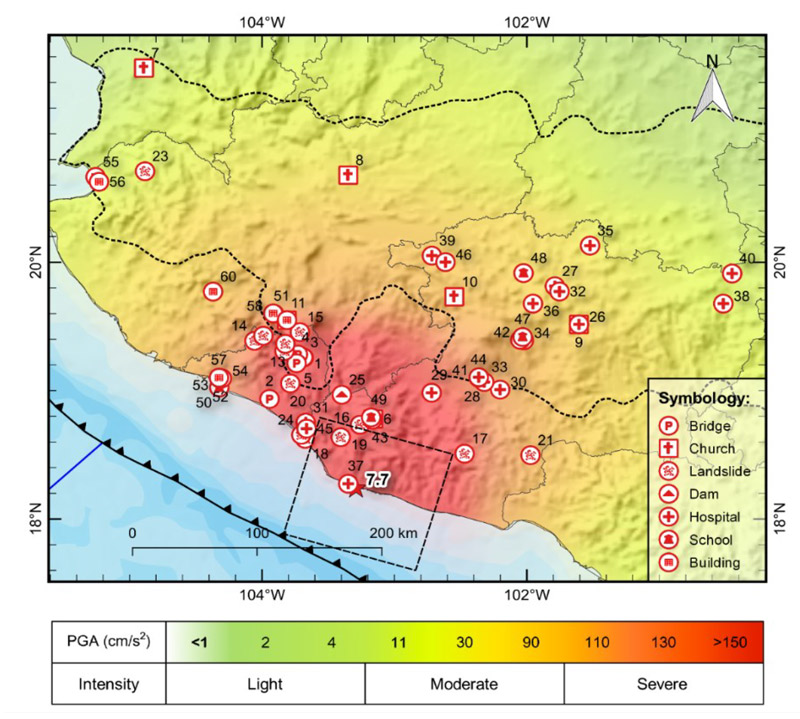
Figure 9. Damage distribution around the epicentral zone. Each structure is identified by an ID linked to Table 1.
Table 1. Structural and Geotechnical Damage reported in the epicentral region
4.2 Real-time estimation of intensities, damage, and fatalities in Mexico City
Mexico's capital has a high-resolution rapid damage assessment system (Ordaz et al. 2017), which provides a quick overview of the impact of earthquakes on the city. Figure 10 presents the spatial distribution of various ground motion parameters of the September 19th, 2022 event: PGA, SA for structural periods 0.3, 1, and 2 s, with values between 3 and 3.35 cm/s2, 5 and 45 cm/s2, 7 and 90 cm/s2 and 8 and 165 cm/s2, respectively. These intensities do not represent a critical seismic hazard to the city. The intensities do not exceed the seismic design spectrum considered for the revision of the limit state denominated "damage limitation" from NTCS-2017 & NTCS-2020, i.e., buildings are expected to attain an immediate occupancy performance level after earthquakes with moderate seismic intensities, as shown later for two sites in Mexico City.
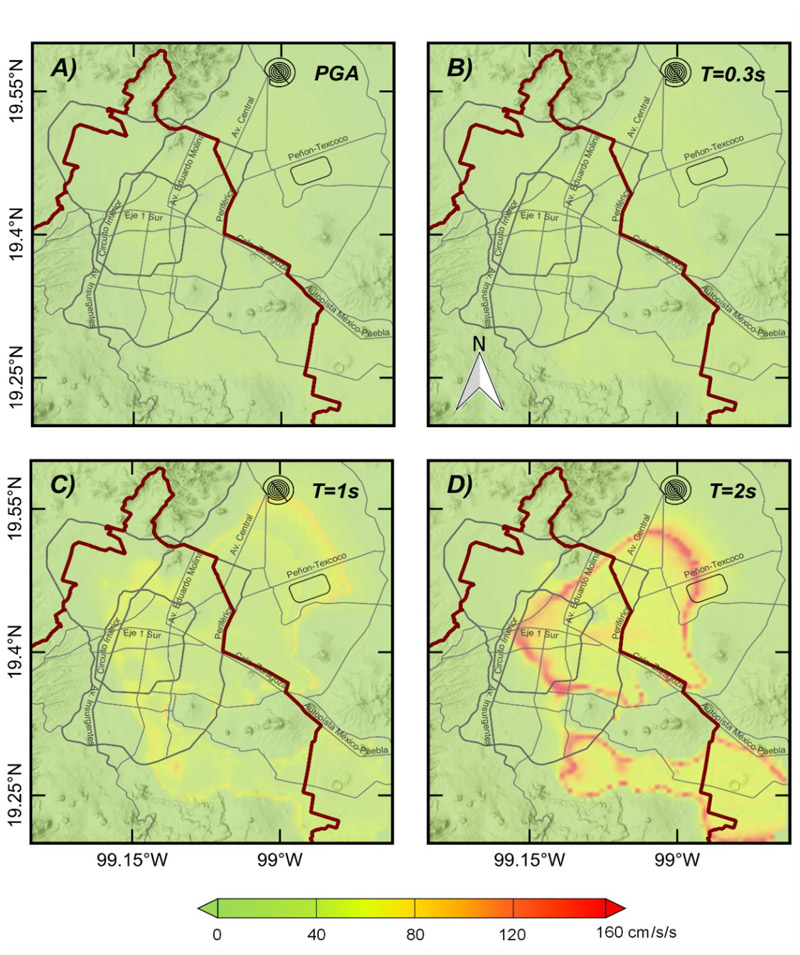
Figure 10. Spatial distribution of A) peak ground acceleration, B, C, and D) spectral intensity for structural period of 0.3, 1, 2 s, for the September 19th, 2022, Earthquake.
Figure 11 presents the predicted locations of building damage, damage to Mexico City's primary water system, and fatalities. The building damage distribution matches the zones where light and moderate damage was reported during the September 19th, 2022, event (top left). Light damage to Mexico City's primary water system is predicted (top right). As confirmed by government authorities, no fatalities were predicted for the city (bottom).
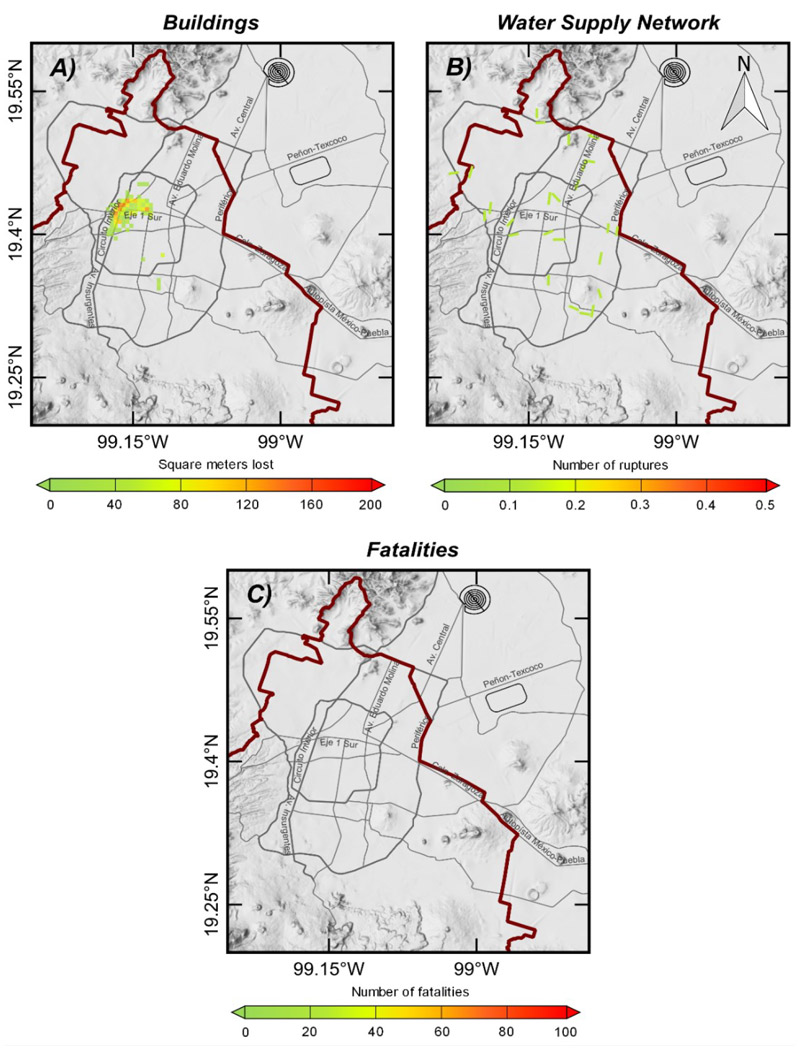
Figure 11. Spatial distribution of a) building damage, b) damage to Mexico City's primary water system and c) fatalities throughout the city.
4.3 Revision of seismic intensities associated to service limit state in Mexico City
Mexico City's seismic design provisions (NTCS 2017, 2020) provide thresholds for maximum inter-story drifts related to the intensity of the damage limit state to protect nonstructural elements from damage (e.g., infill walls, glazing systems). The denominated service limit state can occur several times during the useful life of the structure (i.e., frequent earthquakes). The latter means that structures designed with this criterion are expected to achieve an immediate occupancy performance level after earthquakes under moderate seismic intensities; the constructions are considered to have a linear behavior.
Figure 12 compares the response spectrum computed at CU and SCT stations (orange line) with the design spectrum for the serviceability limit state (SLS) from NTCS-2017 (black line). In this figure, the spectral values plotted corresponds to the RMS of the maximum response of both horizontal components. This ground-motion intensity measure is consistent with that used to derive the design spectrum in the current Mexico City Standard for Seismic Design (NTCS 2017). For both sites, it can be noted that the spectral values computed do not exceed the spectral ordinates (defined for a 20 years return period) of the SLS, which indicates minor or null structural damage that does not affect the operational level of the buildings. The latter agrees with the damage report from the Government of Mexico City (GCM, 2022), which mentions that only twenty-one buildings suffered slight damage i.e., falling ceilings, broken windowpanes, and plaster damage (see Figure 13 and Table 2).
The response spectrum at CU shows a PGA of 5.06 cm/s2 and a peak amplitude of 17.3 cm/s2 at T=2.5s. For SCT, the PGA value corresponds to 18.4 cm/s2 and the peak amplitude to 101.8 cm/s2 at T=1.5s. The spectral shape of the response spectrum at CU is strongly influenced by the site effects present at the station, which yield a large spectral amplification in the period range from 1s to 3s. This condition is particularly atypical at sites classified as firm soils, where peak amplitude is expected to occur at periods below 1s. However, in the firm zone of Mexico City, this amplification is caused by the rather shallow (<1 km) sediments that lie below the volcanic rocks that cover the hill zone of the Valley of Mexico (Ordaz and Singh 1992).
Additionally, the most recent version of the Mexican City Building Code (RCCDMX 2020) specifies that structures need to be inspected when PGA exceeds 90 cm/s2 at the SCT station, located in the soft-soil zone. It is worth mentioning that the previous versions of the Mexico City seismic design provisions did not include such requirements. As mentioned earlier, for the September 19th, 2022, M7.7 earthquake, a PGA of 18.4 cm/s2 was recorded at station SCT.
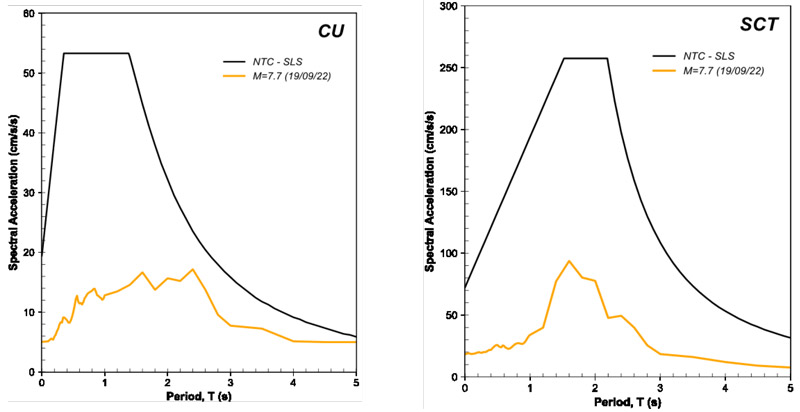
Figure 12. Comparison between the seismic design spectrum considered for the revision of the service limit state (black line) and the response spectrum obtained at CU (left) and SCT (right) stations (orange line), located within the hill and the lake zones of Mexico City, respectively.
4.4 Minor damage reports and seismic intensities associated to service limit state in Mexico City
Figure 13 shows the spatial distribution of the spectral acceleration for T=2 s (values between 8 and 165 cm/s2) and damage reported (GCM, 2022) throughout the city. The damage distribution matches the zones where light and moderate damage was reported. Damage reported to structures in Mexico City is summarized in Table 2. No fatalities were reported due to structural or nonstructural (mechanical, electrical, plumbing, and architectural) or building contents damage.The government of Mexico has traditional insurance to protect the country's infrastructure due to damage caused by natural phenomena. However, these indemnity policies typically assign payments based on the losses made by the seismic event. The claims settlement process can take weeks, months, or even years to resolve. As an alternative to traditional insurance products, since 2006, the government of Mexico has used a parametric insurance, i.e., catastrophe bonds, to eliminate the need to assess the losses of the affected assets, which complements its financial risk transfer caused by natural phenomena.
Table 2. Buildings with light and moderate damage reported in Mexico City
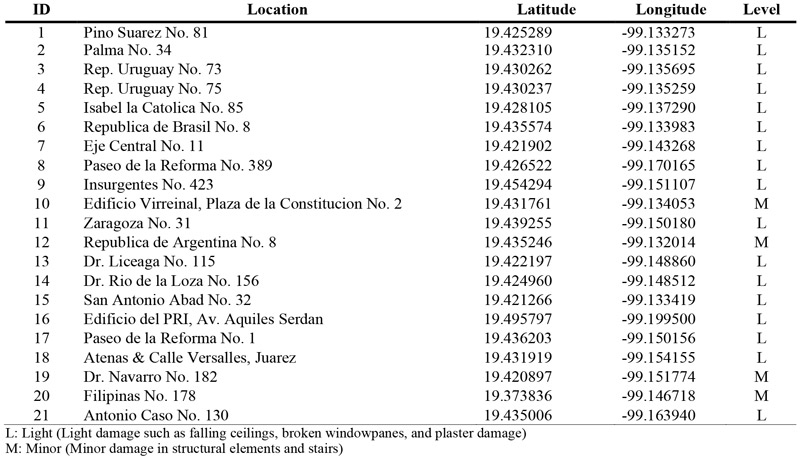
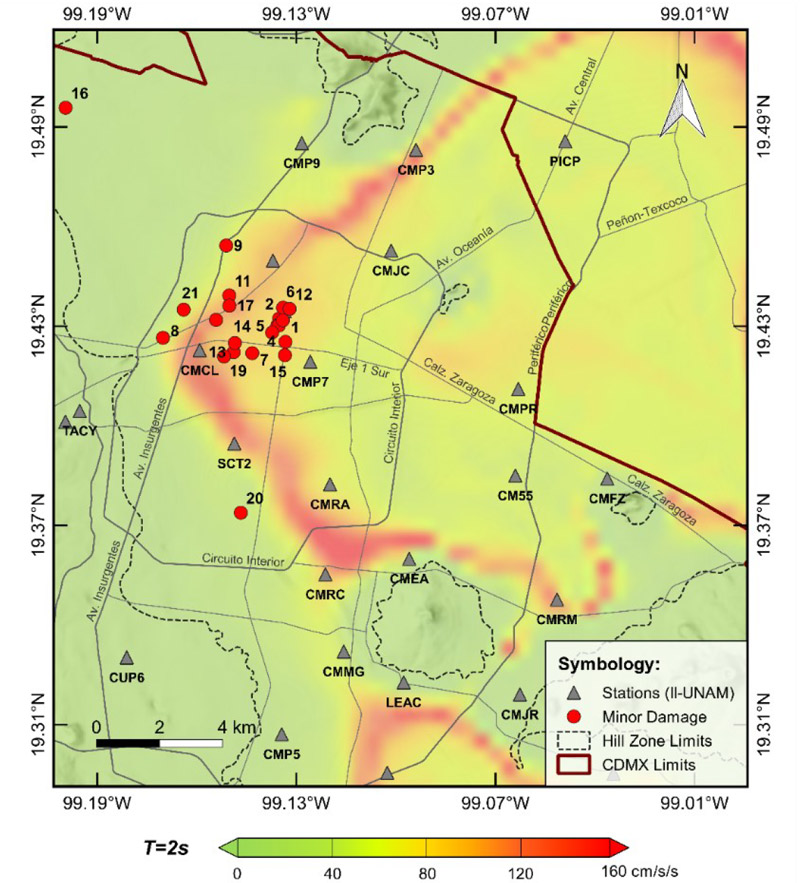
Figure 13. Spatial distribution of the light and moderate damage reported in Mexico City. Each structure is identified by a number, which is keyed to Table 2.
4.5 Mexican catastrophe bonds
Catastrophe bonds, known as CAT bonds, are financial instruments designed for governments so that they can reduce their financial risk, transferring it to capital through investors, by assuring enough post-disaster capital. The rate of interest received by investors is computed considering the estimated risk and certain quantifiable event characteristics such as the magnitude and location of an earthquake (Cummins, 2008; Goda, 2013; Pucciano et al., 2017). A CAT bond is a parametric tool where the conditions of payment are related to the physical measurements of the catastrophic event. In CAT bonds, a trigger event is established in the agreement, the occurrence of which is linked by default to coupon-paying bonds. The bonds usually cover a predefined time period varying from one to five years; a common duration for Mexico is three years. If the occurrence of a catastrophe covered by the bond exceeds the trigger event at any time before the contract expires, the bond defaults to cover the indemnities of the issuer from all or a portion of the principal paid for the bond by the investor. The issuers stop paying premiums when the trigger event happens. Unlike traditional insurance, in CAT bonds the premium contract covers other costs, like transaction and capital costs and profit margins.
Although CAT bonds appear attractive, these bonds have not effectively mitigated the effects of natural disasters on Mexico in almost any case since the first CAT bond was issued in 2006 (Cardenas et al. 2007). Around US$277 million in premiums have been paid by the Mexican government, while the government received only US$200 million.
The parametric insurance cover has been triggered twice, and the country has received the payments of the bond the same number of times. When the most powerful storm ever recorded in the Western Hemisphere, Hurricane Patricia, triggered Mexico's parametric insurance in 2015, only US$50 million were recovered (half of the established payment from the MultiCat Mexico 2012 for the tranche exposed only to hurricanes that impact the Pacific coast of Mexico). The other payment was from the FONDEN CAT bond in 2017, where US$150 million (the total of the established payment for the parametric earthquake protection) was paid for the September 7th, 2017, Earthquake (M8.2) (World Bank, 2020). However, the recent September 19th, 2022, Earthquake (M7.7), a subduction event located about ~370 km outside of Mexico City, severely struck the states of Colima and Michoacan, but the earthquake parameters of epicenter location, depth, and magnitude were not sufficient to trigger the payment of the two catastrophe bonds.
An earthquake with a relatively medium magnitude cannot necessarily be correlated with the losses that it causes. Studies considering the complexity of the seismic phenomena (in which magnitude, depth, and location are not the only parameters among many others that must be taken into account e.g., peak ground acceleration and spectral accelerations) should be incorporated into the development of insurance financial instruments, to more effectively cover people, their belongings and property in Mexico.
CONCLUSIONS AND PERSPECTIVES
On September 19th, 2022, an M7.7 interplate earthquake occurred 4 km from Coalcoman, Michoacan, and 400 km from Mexico City. The Earthquake generated ground motions with large RMS horizontal peak accelerations; a value of 902 cm/s2 at the station MMIG (maintained by the SSN) located in Michoacan about 8 km from the epicenter. A summary of the peak values at stations operated by the Institute of Engineering was published by the UNAM's Seismic Instrumentation Unit (UIS, 2022)
The Coalcoman earthquake disrupted the population because of its damaging and psychosocial risk factors and because it occurred precisely on the same date as the 1985 and 2017 catastrophic earthquakes that are still in the memory of many Mexicans. Some people now believe earthquakes in Mexico are more likely to occur on September 19th. Nevertheless, the choice and preservation of September 19th as the date for a national earthquake drill and Memorial Day for the victims of the 1985 and 2017 earthquakes may help to promote and justify the need for earthquake drills.
The Ground Motion Prediction Equations for subduction earthquakes agree reasonably well with the observed values. In contrast, the specific GMPEs developed for firm-soil at CU station for subduction earthquake needs to be reviewed. We observe differences between the observed values and the models for the 2022 event.
For sites around the epicentral region, the spatial intensity distributions roughly match the zones where the media reported structural and geotechnical damage.
For Mexico City, located about 370 km from the epicentral region, light and moderate damage of 21 buildings was reported by government authorities. The seismic intensities generated by the event did not exceed the design intensities indicated in the new seismic provisions associated with the service limit state. The latter implies that structures designed with this criterion are expected to achieve an occupancy level after an earthquake under moderate seismic intensities, which can occur several times during the useful life of the structure; the Coalcoman event was a good test for this limit state.
Further research is needed to incorporate the complexity of the seismic phenomena in developing insurance financial instruments such as Mexican Catastrophe Bonds to more effectively cover people, their belongings, and property in Mexico.
A review of the seismic hazard and structural and geotechnical performance of structures after an earthquake will allow improvements in the decision-making process and estimate the country's vulnerability, risk, and resilience, all challenging topics in earthquake engineering and public policy. This preliminary report intends to inform other researchers, policymakers, practitioners, and the general public of the current knowledge of the M7.7 September 19th Coalcoman event. However, a final structural and geotechnical damage evaluation and analysis of the seismological aspects of the event is in process. The latter will include a summary of the field reconnaissance campaigns by the Institute of Engineering. Finally, we aim to extend the conversation and data availability to a broader audience to drive collaborations among institutions in Mexico and abroad.
ACKNOWLEDGMENTS
This report is part of the institutional effort of the Institute of Engineering's commission regarding the M7.7 Coalcoman September 19th, 2022, Earthquake. The data used in this work were provided by RAII –UNAM and SSN National Seismological Service seismic networks through the Mexican Seismic Network project and the project Seismic Network of Mexico City. We thank its personnel for station maintenance, data acquisition and distribution. We thank Carlos Mendoza from the Center of Geosciences at UNAM, Juriquilla, who provided the finite fault model to perform the 3D simulation. Juan Manuel Espinoza and Armando Cuellar, from CIRES, provided the information required and acceleration records for Mexico City. Oscar Zepeda, from the Civil Protection Coordination, provided and pointed out key information and sources. Leila Kasandra Davila Olmedo helped collecting and verifying some of the damage reports included in this document. Any trade, product, or firm name use is for descriptive purposes only and does not imply endorsement by the National Autonomous University of Mexico or any institution mentioned. All computations were performed at the Rosenblueth cluster at the Institute of Engineering.
REFERENCES
Arroyo, D., D. Garcia, M. Ordaz, M. A. Mora, and S. K. Singh. (2010). Strong ground-motion relations for Mexican interplate earthquakes, Journal of Seismology, 14(4), 769-785.
Bielak, J., R.W. Graves, K.B. Olsen, R. Taborda, L. Ramirez-Guzman, S.M. Day, G.P. Ely, D. Roten, T.H. Jordan, P.J. Maechling, and J. Urbanic. (2010). The ShakeOut earthquake scenario: Verification of three simulation sets, Geophysical Journal International, 180(1), 375-404.
Cardenas, V., S. Hochrainer, R. Mechler, G. Pflug, and J. Linnerooth-Bayer (2007). Sovereign financial disaster risk management: the case of Mexico, Environmental Hazards, 7(1), 40-53.
CNPC (2022a). Informe de Coordinación Nacional de Protección Civil. Gabinete de Seguridad (in Spanish).
CNPC (2022b). Coordinación Nacional de Protección Civil https://twitter.com/CNPC_MX/status/1571940576123322370
Cummins, J. D. (2008). Cat bonds and other risk‐linked securities: state of the market and recent developments, Risk Management and Insurance Review, 11(1), 23-47.
DeMets, C., Gordon, R.G., Argus, D.F. and Stein, S. (1994). Effect of recent revisions to the geomagnetic reversal time scale on estimates of current plate motions, Geophys. Res. Lett., 21: 2191-2194. https://doi.org/10.1029/94GL02118
EM-DAT (Emergency events database) (2022). International disaster, Université Catholique de Louvain, Brussels, www.emdat.be. Accessed September 24th, 2022.
Goda, K. (2013). Basis Risk of Earthquake Catastrophe Bond Trigger Using Scenario-Based versus Station Intensity–Based Approaches: A Case Study for Southwestern British Columbia, Earthquake Spectra, 29(3), 757-775.
GCM (2022). Gobierno de la Ciudad de México, Síntesis informática Jefa de Gobierno, 20 de septiembre de 2022. URL:
https://www.jefaturadegobierno.cdmx.gob.mx/storage/app/media/Sintesis%20Informativa/SEPTIEMBRE%202022/200922/JEFA%20DE%20GOBIERNO%20200922.pdf (in Spanish)
Jaimes, M. A., E. Reinoso, and M. Ordaz. (2006). Comparison of methods to predict response spectra at instrumented sites given the magnitude and distance of an earthquake, Journal of Earthquake Engineering, 10(06), 887-902.
Jaimes, M. A., and A. D. Garcia‐Soto. (2019). Probability of the occurrence of two significant earthquakes on the same date (of different years) striking the same site: The Mexico City case, Seismological Research Letters, 90(1), 378-386.
Juarez-Zuñiga, A. and L. Ramirez-Guzman (2016). Adjoint-wavefield tomography of Southcentral Mexico, Geological Society of America Annual Meeting, Denver, CO.
LeVeque, R. J., D. L. George, and M. J. Berger. (2011). Tsunami modelling with adaptively refined finite volume methods, Acta Numerica, 20, 211-289.
Mateos, JL. (2022). https://twitter.com/jlmateos?lang=es
Meli, R. (1986). Evaluación de los efectos de los sismos de 1985 en los edificios de la ciudad de Mexico (3 volumes y 7 annexes), Informe Interno DE/EST-V2/1, Instituto de Ingenieria, UNAM (in Spanish).
Mendoza, C., and M. R. Martinez-Lopez. (2022). Rapid finite-fault analysis of large Mexico earthquakes using teleseismic P waves, Journal of Seismology, 26(2), 333-342.
NTCS-2017 (2017) Normas Técnicas Complementarias para Diseño por Sismo, Reglamento de Construcciones para la Ciudad de México, Gaceta Oficial de la Ciudad de México (in Spanish).
NTCS-2020 (2020) Normas Técnicas Complementarias para Diseño por Sismo, Reglamento de Construcciones para la Ciudad de México, Gaceta Oficial de la Ciudad de México (in Spanish).
Ordaz M, Singh SK (1992). Source spectra and spectral attenuation of seismic waves from Mexican earthquakes, and evidence of amplification in the hill zone of Mexico City, Bulletin of the Seismological Society of America 82, 24-43
Ordaz, M., Reinoso, E., Jaimes, M. A., Alcantara, L., & Perez, C. (2017). High-resolution early earthquake damage assessment system for Mexico City based on a single-station, Geofisica internacional, 56(1), 117-135.
Ordaz, M. (2022). https://twitter.com/marioordazs?lang=da
Parker, G. A., J. P. Stewart, D. M. Boore, G. M. Atkinson, and B. Hassani. (2022). NGA-subduction global ground motion models with regional adjustment factors, Earthquake Spectra, 38(1), 456-493.
Pucciano, S., G. Franco, and P. Bazzurro. (2017). Loss predictive power of strong motion networks for usage in parametric risk transfer: Istanbul as a case study, Earthquake Spectra, 33(4), 1513-1531.
RCCDMX (2020) Reglamento de Construcciones para el Distrito Federal. Gaceta Oficial de la Ciudad de Mexico, December 15 (in Spanish).
Reyes, C. (1999). El estado límite de servicio en el diseño sísmico de edificios, Doctor Thesis, School of Engineering, National University of Mexico (in Spanish).
Rosenblueth, E. and R. Meli. (1986). The 1985 Mexico earthquake. Concrete International, 8(5), 23-34.
Singh, S. K., M. Ordaz, X. Perez-Campos, and A. Iglesias. (2015). Intraslab versus interplate earthquakes as recorded in Mexico City: Implications for seismic hazard, Earthquake Spectra, 31(2), 795-812.
Somerville, P. G., N.F. Smith, R. Graves, and N.A. Abrahamson, N. A. (1997). Modification of empirical strong ground motion attenuation relations to include the amplitude and duration effects of rupture directivity, Seismological Research Letters, 68(1), 199-222.
SMN (2022) Servicio Mareográfico Nacional https://twitter.com/smareograficon?lang=en
SSN (2022) Universidad Nacional Autónoma de México, Instituto de Geofísica, Servicio Sismológico Nacional (2021), Catálogo de sismos. UNAM, IGEF, SSN. http://www2.ssn.unam.mx:8080/catalogo/
Tu, T., H. Yu, L. Ramirez-Guzman, J. Bielak, O. Ghattas, K. L. Ma, and D. R. O'hallaron. (2006, November). From mesh generation to scientific visualization: An end-to-end approach to parallel supercomputing, In SC'06: Proceedings of the 2006 ACM/IEEE conference on Supercomputing (pp. 12-12). IEEE.
UIS (2022). Universidad Nacional Autónoma de México, Instituto de Ingeniería, Reportes Especiales, Sismos del 19 de Septiembre de 2022, Sur de Coalcoman, Michoacan, Mexico
http://www.uis.unam.mx/PDF/UIS-IIUNAM_rep_prelim_20220919_130509_MICH_M7_7.pdf.
USGS (2022) United States Geological Survey
https://earthquake.usgs.gov/earthquakes/eventpage/us7000i9bw/executive
World Bank (2020). Case study: Insuring Mexico against Natural Disasters. Washington, DC. World Bank. https://bit.ly/3aKyobj
Zhao, J. X., J. Zhang, A. Asano, Y. Ohno, T. Oouchi, T. Takahashi, and Y. Fukushima. (2006). Attenuation relations of strong ground motion in Japan using site classification based on predominant period, Bulletin of the Seismological Society of America, 96(3), 898-913